Elevating Standups: Harnessing Performance Metrics for Software Development
In the fast-paced world of software development, daily standups are a cornerstone for team synchronization. Yet, even with the best intentions, these meetings can sometimes feel like a repetitive exercise in reporting, lacking the deep, data-driven insights needed to truly optimize team performance. As teams strive for greater efficiency, predictability, and continuous improvement, merely stating 'what I did yesterday' and 'what I'll do today' often falls short. The real game-changer lies in integrating objective, quantifiable data into these daily rituals – specifically, by leveraging robust performance metrics for software development.
The Evolving Landscape of Software Development
Modern software development teams operate in complex environments, juggling multiple projects, tight deadlines, and ever-increasing expectations for quality and speed. Traditional methods of tracking progress, often reliant on subjective reports or manual updates, can obscure underlying issues, making it difficult to pinpoint bottlenecks, assess risks, or celebrate true successes. This is where the strategic application of software development metrics becomes indispensable.
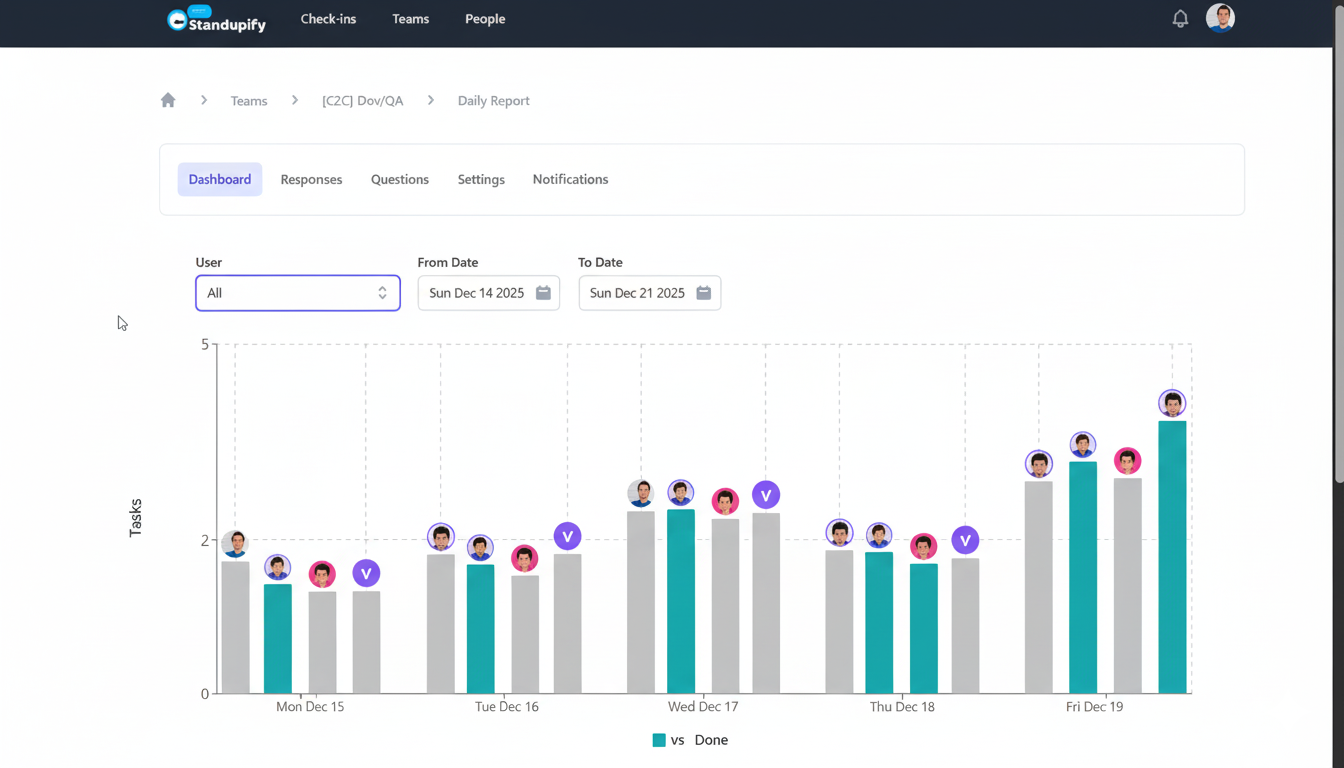
For teams utilizing automated standup bots like Standupify in Google Chat, there's an incredible opportunity to move beyond simple status updates. By feeding your standup bot with relevant performance data, you can transform daily check-ins into powerful analytical sessions, fostering a culture of transparency and data-informed decision-making. This shift not only streamlines the standup process but also empowers teams with actionable insights to drive meaningful improvements.
Understanding Key Performance Metrics for Software Development
So, what exactly are these crucial performance metrics for software development? They are quantifiable measures that provide objective insights into various aspects of a team's development process, from code quality to delivery speed. Focusing on the right metrics can illuminate areas for improvement and validate successful practices. Here are some of the most impactful categories:
- DORA Metrics (DevOps Research and Assessment): These four key metrics are widely recognized for predicting organizational performance:
- Deployment Frequency: How often an organization successfully releases to production.
- Lead Time for Changes: The time it takes for a commit to get into production.
- Change Failure Rate: The percentage of changes to production that result in degraded service and require remediation.
- Time to Restore Service: How long it takes to restore service when a disruption occurs.
- Cycle Time: The total time it takes for a work item to go from 'in progress' to 'done'. A shorter cycle time generally indicates higher efficiency and faster delivery.
- Throughput: The number of work items completed within a given period. This metric helps measure a team's capacity and delivery pace.
- Code Quality Metrics: Measures like code coverage, cyclomatic complexity, and static analysis findings can indicate the maintainability and reliability of the codebase.
- Team Collaboration Metrics: While harder to quantify directly, metrics like pull request review times or commit frequency can shed light on collaboration patterns.
Understanding and tracking these metrics provides a holistic view of a team's health, enabling leaders and team members to move beyond guesswork and make decisions based on concrete evidence. They are not just numbers; they are indicators of efficiency, quality, and responsiveness.
The Power of Integration: Metrics + Automated Standups
The real magic happens when these powerful performance metrics for software development are seamlessly integrated into your daily workflow, particularly through automated standup bots. Imagine your Standupify bot not just asking for updates, but also presenting a concise, data-backed summary of the team's performance trends directly within Google Chat. This integration bridges the gap between raw data and daily context, making metrics immediately relevant and actionable.
For instance, tools like DevActivity, an AI-powered GitHub analytics and gamification platform, specialize in collecting, analyzing, and visualizing these critical metrics. By connecting such analytics platforms with your Google Chat standup bot, you can automate the process of bringing data to the forefront of your daily discussions. Instead of manually compiling reports, the bot can fetch real-time insights on deployment frequency, lead time, or active pull requests, providing an objective backdrop for each team member's update.
Actionable Insights: How Integrated Metrics Transform Standups
Integrating data-driven performance metrics into your automated standups offers a multitude of benefits that directly impact team efficiency, collaboration, and overall project success.
Improved Accuracy and Context for Updates
When team members provide updates, they often rely on memory or quick glances at their task boards. With integrated metrics, their updates gain immediate context and accuracy. If a developer mentions working on a feature, the bot could simultaneously display the current cycle time for features in that project, prompting a more informed discussion about potential delays or accelerators. This reduces ambiguity and ensures everyone is on the same page, grounded in objective data.
Proactive Problem Identification and Bottleneck Resolution
Automated standup bots can be configured to highlight deviations in key metrics. If deployment frequency drops, or lead time for changes increases significantly, the bot can flag this during the standup. This allows the team to address potential bottlenecks proactively, rather than discovering them weeks later when they've already impacted the project timeline. It transforms standups from mere reporting sessions into strategic problem-solving forums.
Fostering a Culture of Continuous Improvement
By regularly reviewing performance metrics for software development, teams naturally develop a mindset of continuous improvement. Seeing trends in metrics like change failure rate or code quality can spark discussions on process refinements, better testing practices, or more effective code reviews. The data provides a neutral ground for constructive feedback and experimentation, encouraging teams to collectively own their performance and strive for excellence.
Objective Discussions and Enhanced Accountability
Metrics provide an objective basis for discussions, moving away from subjective opinions. When a team sees that their deployment frequency has improved or that code review times have shortened, it builds morale and provides tangible evidence of progress. Conversely, if metrics indicate areas needing attention, the discussion can focus on 'what' the data shows and 'how' to improve, rather than 'who' is responsible, fostering a healthier, more accountable team environment.
Implementing Performance Metrics in Your Standup Workflow
Adopting a data-driven approach to standups doesn't require an overnight overhaul. Start by identifying a few key performance metrics for software development that are most relevant to your team's goals. Integrate an analytics tool that can pull data from your existing development platforms (like GitHub, GitLab, Jira) and then configure your Google Chat standup bot, such as Standupify, to periodically fetch and display these insights. Begin with simple summaries, gradually introducing more detailed trends as your team becomes comfortable interpreting and acting upon the data. The goal is to augment, not replace, human interaction and decision-making with objective insights.
Conclusion
The future of effective team collaboration in software development lies in combining streamlined communication with data-driven insights. By integrating robust performance metrics for software development with automated standup bots, teams can transform their daily check-ins from routine reports into powerful strategic discussions. This approach not only enhances the accuracy of daily updates but also empowers teams to identify issues faster, make informed decisions, and cultivate a culture of continuous improvement, ultimately leading to higher quality software and more predictable delivery.