Mastering Team Performance: The Google Workspace Dashboard and Google Chat Standups
In today's fast-paced, often distributed work environments, effective team management hinges on clear communication and insightful performance tracking. Google Workspace has become the backbone for countless organizations, providing a robust suite of tools for collaboration. However, simply using these tools isn't enough; understanding how your team utilizes them and progresses on projects is paramount. This is where the synergy between a dedicated Google Chat standup bot and a comprehensive google workspace dashboard truly shines, offering team leads an unparalleled view into participation, project velocity, and overall team health.
The Evolving Landscape of Team Collaboration
The modern workplace demands agility and transparency. Teams rely heavily on digital communication platforms, with Google Chat emerging as a central hub for many Google Workspace users. While Google Chat facilitates instant messaging and group discussions, managing daily standups – a critical agile practice – can still be a manual chore without the right tools. Ensuring every team member provides their updates consistently, and then aggregating that information into actionable insights, presents a significant challenge for team leads.
The Power of Google Chat Standup Bots
Enter solutions like Standupify. Our Google Chat bot is specifically designed to streamline the daily standup process, transforming it from a time-consuming meeting into an efficient, asynchronous update mechanism. Standupify automates update requests, collects responses directly within Google Chat, and integrates with your existing task tracking systems. This not only saves valuable meeting time but also creates a structured, accessible record of daily progress, blockers, and plans. The data collected by a standup bot—who submitted, what they worked on, what's next, and any impediments—becomes an invaluable dataset for understanding team dynamics.
Unlocking Deeper Insights with the Google Workspace Dashboard
While a standup bot excels at collecting daily updates, the real strategic advantage comes from integrating this rich data into a broader, more powerful analytics platform: a google workspace dashboard. Imagine having a single pane of glass that not only shows your team's standup participation but also correlates it with their activity across Google Drive, Google Meet, and Google Chat. This holistic view moves beyond mere reporting, offering deep, actionable insights into how your team collaborates and performs.
A well-designed google workspace dashboard aggregates data from various Google Workspace applications, presenting it in intuitive visualizations. For team leads, this means moving beyond anecdotal observations and relying on concrete metrics. It helps answer critical questions: Are team members engaging effectively? Where are the communication bottlenecks? Is project velocity consistent, or are there recurring dips? Without such a dashboard, this crucial context often remains hidden, making informed decision-making a significant challenge.
Introducing Workalizer: AI-Powered Google Workspace Insights
To truly harness the power of your Google Workspace data, specialized tools are essential. This is where platforms like Workalizer come into play. Workalizer provides AI-powered insights for Google Workspace apps, offering a comprehensive view of activity across Drive, Meet, and Chat. By integrating data from these diverse sources, a platform like Workalizer helps you understand team collaboration patterns, identify productivity trends, and optimize workflows. For a deeper dive into what a robust dashboard can offer, you can explore comprehensive Google Workspace dashboard solutions like Workalizer. Such tools transform raw data into intelligent insights, making it easier for team leads to monitor and improve performance.
Connecting Standupify with Your Google Workspace Dashboard for Enhanced Performance
The true magic happens when you connect the structured data from your Google Chat standup bot, like Standupify, with the analytical capabilities of a comprehensive google workspace dashboard. This integration creates a powerful feedback loop, allowing team leads to track participation and project velocity with unprecedented accuracy.
Tracking Participation and Engagement
A standup bot ensures daily updates are submitted. When this data flows into a google workspace dashboard, you gain immediate visual insights into team engagement. The dashboard can display:
- Standup Completion Rates: See at a glance which team members are consistently submitting their updates and who might be falling behind. This isn't about micromanagement; it's about identifying potential communication gaps or team members who might need additional support.
- Response Timeliness: Track if updates are submitted within the expected timeframe, indicating adherence to agile practices and overall team discipline.
- Engagement Trends: Over time, the dashboard can reveal patterns in participation, perhaps correlating with project phases, team changes, or specific challenges.
By visualizing these metrics, team leads can proactively address issues, foster consistent communication, and ensure everyone is aligned and contributing effectively.
Monitoring Project Velocity and Bottlenecks
Beyond simple participation, the integration provides profound insights into project velocity. Standupify's task tracker integration ensures that daily updates are linked to specific tasks or projects. When this data is fed into a google workspace dashboard, you can:
- Visualize Progress Against Goals: The dashboard can overlay standup-reported progress with project timelines and task completion data from your integrated task tracker. This gives a real-time pulse on whether the team is on track.
- Identify Bottlenecks: If multiple team members consistently report blockers related to a specific dependency or a particular individual, the dashboard can highlight this pattern. This allows leads to intervene quickly, allocate resources, or remove obstacles before they escalate into major project delays.
- Assess Individual and Team Velocity: By analyzing the volume and complexity of tasks reported as 'done' in standups over time, correlated with task tracking data, team leads can gain a clearer understanding of individual and collective output. This helps in resource planning, workload distribution, and performance reviews.
Identifying Trends and Optimizing Workflows
The historical data accumulated in your google workspace dashboard from daily standups and other Workspace activities is invaluable for long-term optimization. You can identify seasonal trends in productivity, pinpoint common types of blockers, or discover which communication channels are most effective for certain tasks. This data-driven approach allows for continuous improvement of team processes, resource allocation, and even project planning.
Real-World Impact: A Synergistic Approach
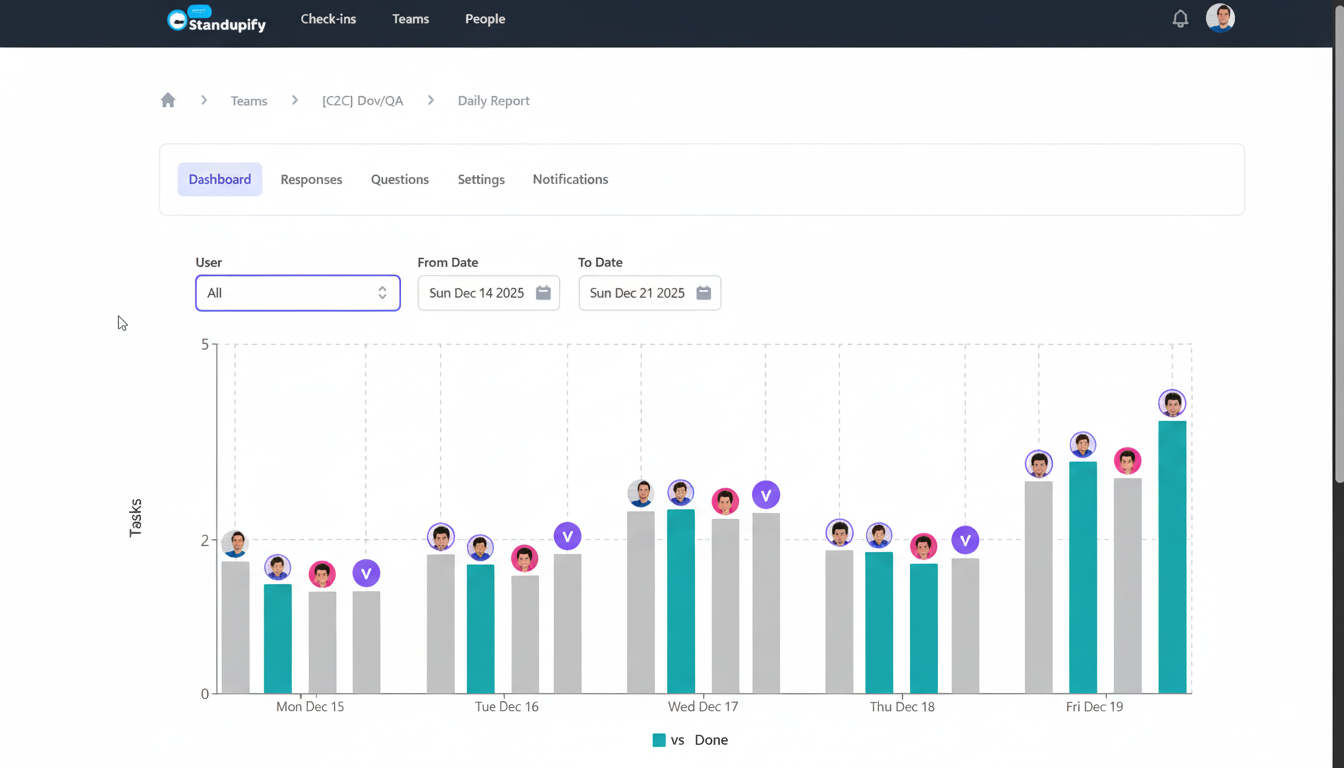
Consider a team lead managing a software development project. With Standupify, daily updates on code commits, bug fixes, and feature progress are seamlessly collected in Google Chat. This data, when pushed to a google workspace dashboard like Workalizer, transforms into a dynamic project overview. The lead can see a graph of standup completion rates, ensuring everyone is engaged. Alongside, they can view a chart showing the team's weekly task velocity, identifying if the pace is accelerating or decelerating. If a specific team member frequently reports 'waiting for design feedback' in their standups, and the dashboard also shows low activity in a shared design folder, the lead can immediately spot a potential bottleneck between development and design. This integrated view empowers proactive management, allowing for timely interventions that keep projects on schedule and teams performing optimally.
Conclusion
The future of team performance management in Google Workspace environments lies in intelligent integration. By combining the efficiency of a Google Chat standup bot like Standupify with the comprehensive analytical power of a google workspace dashboard, team leads gain an unparalleled ability to track participation, monitor project velocity, and foster a more transparent and productive work environment. This synergistic approach not only saves time but also provides the deep insights necessary to make data-driven decisions, optimize workflows, and ultimately drive greater success for your team and organization. Embrace the power of integrated insights and elevate your team's performance today.