Unlocking Team Potential: How Developer KPIs Drive Engineering Success
In the fast-paced world of software development, understanding and optimizing team performance is paramount. Yet, truly measuring developer productivity and team effectiveness can feel like an elusive quest. How do you quantify the impact of a brilliant solution or the efficiency of a well-oiled team? The answer lies in carefully selected developer KPI (Key Performance Indicators). These metrics provide objective insights into various facets of the development lifecycle, helping teams identify strengths, pinpoint areas for improvement, and ultimately, achieve their engineering goals. But collecting and interpreting these KPIs effectively requires more than just raw data; it demands smart tools that integrate seamlessly into your workflow.
The Indispensable Role of Developer KPIs in Modern Engineering
For too long, developer performance was often assessed through subjective measures or simplistic metrics like lines of code, which rarely reflect true value. Modern engineering demands a more nuanced approach. Tracking relevant developer KPI allows teams to move beyond guesswork, fostering a culture of data-driven decision-making and continuous improvement. These metrics serve several critical purposes:
- Enhanced Visibility: Managers gain a clear, objective view of team and individual contributions, progress, and potential bottlenecks.
- Performance Improvement: By highlighting trends and areas of inefficiency, KPIs enable teams to implement targeted strategies for improvement, whether it's optimizing code review processes or reducing deployment lead times.
- Goal Alignment: KPIs help align individual and team efforts with broader organizational objectives, ensuring everyone is pulling in the same direction.
- Fair Evaluation & Recognition: Objective data provides a foundation for fair performance reviews and helps recognize high-performing individuals and teams based on tangible results.
- Proactive Problem Solving: Early detection of declining metrics can signal potential issues like burnout, technical debt, or process inefficiencies before they escalate.
Examples of valuable developer KPI include DORA metrics (Deployment Frequency, Lead Time for Changes, Mean Time to Recover, Change Failure Rate), cycle time, pull request size, code churn, code review duration, and issue resolution time. Each offers a unique lens through which to understand different aspects of the development process.
Standupify: Your Daily Pulse for Qualitative Insights
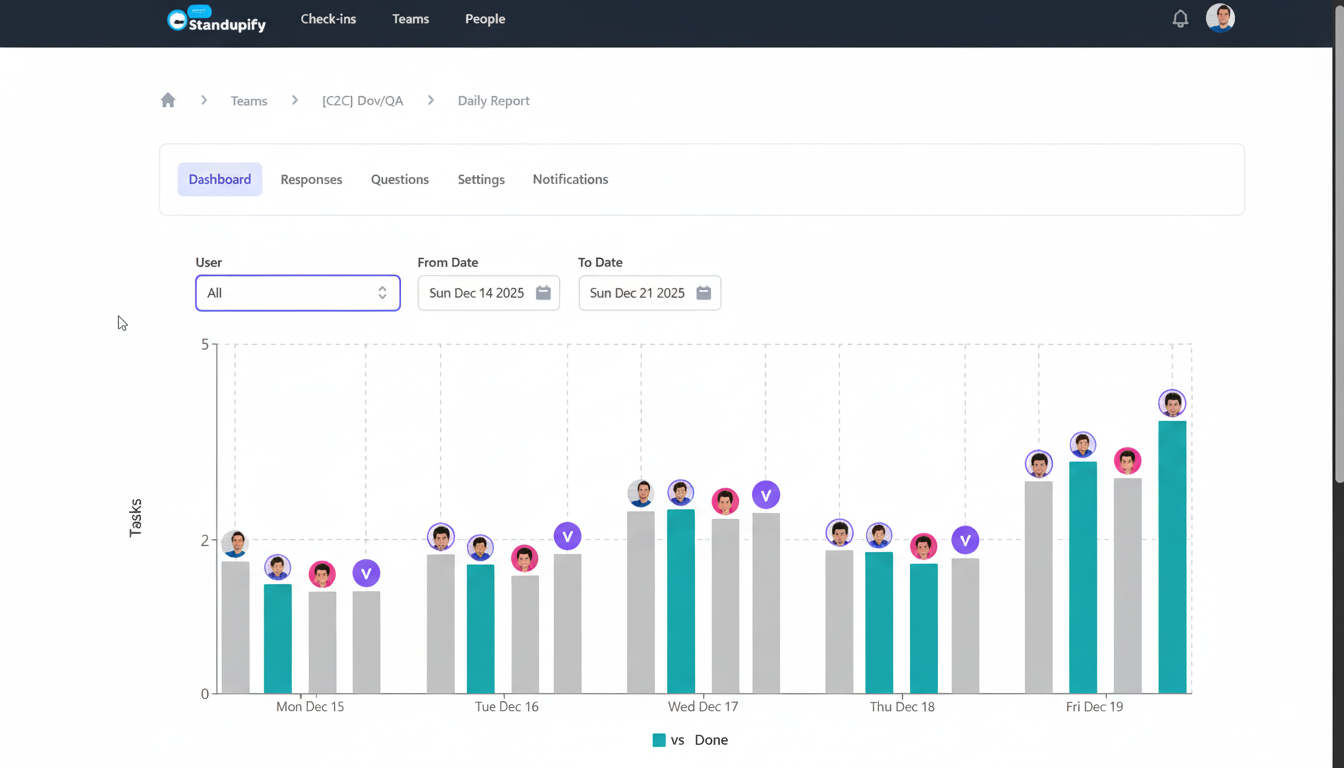
Before diving deep into quantitative metrics, it's crucial to understand the daily pulse of your team. This is where tools like Standupify, a Google Chat bot for daily standups, become invaluable. Standupify streamlines the often time-consuming process of daily standup meetings by automating updates directly within Google Chat. Team members can quickly report on:
- What they accomplished yesterday.
- What they plan to work on today.
- Any blockers they are currently facing.
This automated approach offers several benefits:
- Time-Saving: Eliminates the need for synchronous meetings, especially beneficial for distributed or asynchronous teams.
- Consistency: Ensures everyone provides updates in a structured format, making information easier to digest.
- Transparency: All team members and relevant stakeholders have immediate access to updates, fostering a shared understanding of progress.
- Early Blocker Detection: Critical issues are surfaced quickly, allowing leads to intervene and resolve problems before they cause significant delays.
While Standupify primarily gathers qualitative data, it provides essential context for the quantitative developer KPI. Knowing what a developer *said* they would do, or what blockers they *reported*, is crucial for interpreting the raw numbers from your code repository.
DevActivity: Deep Diving into Performance with AI-Powered GitHub Analytics
While daily standups provide the narrative, objective data paints the full picture. This is where a powerful tool like DevActivity comes into play. DevActivity is an AI-powered GitHub analytics and gamification tool designed to provide deep, actionable insights into your engineering team's performance. It goes beyond surface-level metrics to offer a comprehensive view of your development process, focusing heavily on concrete developer KPI derived directly from your GitHub activity.
DevActivity tracks a wide array of metrics, including but not limited to:
- Commit Frequency & Size: Understanding patterns in code contributions.
- Pull Request (PR) Metrics: Lead time for PRs, PR size, time to merge, and review coverage.
- Code Review Efficiency: How quickly and thoroughly code reviews are conducted.
- Issue Resolution Times: Tracking the lifecycle of tasks and bugs from creation to closure.
- Developer Productivity Index: A composite score that provides a holistic view of individual and team output.
The AI component of DevActivity helps identify trends, predict potential issues, and benchmark performance against industry standards. Furthermore, its gamification features transform performance tracking into an engaging experience. By recognizing achievements, celebrating milestones, and fostering healthy competition, DevActivity motivates developers and boosts team morale. For a deeper look into the specific metrics and insights it offers, you can explore DevActivity's comprehensive developer KPI tracking. This objective data is fundamental to understanding your team's true engineering velocity and quality.
The Synergy: Combining Standupify and DevActivity for Holistic Performance
The real power emerges when you integrate the qualitative insights from Standupify with the quantitative data from DevActivity. This combination creates a holistic view of your team's performance, allowing you to connect the 'what' (from standups) with the 'how' and 'how much' (from analytics). Imagine the following scenarios:
- Connecting Daily Updates to Code Activity: A developer reports in Standupify that they are working on a critical feature. DevActivity can then confirm this by showing recent commits, pull requests, or active branches associated with that developer and feature. If there's a disconnect (e.g., reported progress but no corresponding code activity), it's an immediate flag for a deeper conversation.
- Validating Blockers and Identifying Bottlenecks: A team member frequently reports a specific type of blocker in Standupify. DevActivity's metrics might reveal a consistently long code review time for certain modules or a high change failure rate for specific types of tasks, thus validating the blocker's impact and pointing to systemic issues.
- Informing Standup Discussions: Insights from DevActivity can directly inform the focus of daily standups or retrospective meetings. For example, if DevActivity highlights a spike in code churn or an increase in lead time for changes, these can become key discussion points for the team to address.
- Gamification and Recognition: Achievements recognized by DevActivity (e.g., shortest PR lead time, most thorough code reviews, highest contribution score) can be celebrated during daily standups, boosting morale and reinforcing positive behaviors.
- Data-Driven Sprint Planning and Retrospectives: By combining the qualitative feedback on sprint progress from Standupify with the hard data on velocity and quality from DevActivity, teams can conduct more effective sprint planning and retrospectives, making data-informed adjustments to their processes.
This integrated approach helps engineering managers move beyond anecdotal evidence, providing a robust framework for understanding and improving team performance. It fosters a culture of accountability and transparency, where both individual contributions and collective efforts are clearly understood and measurable against defined developer KPI.
Achieving Engineering Goals with Data-Driven Decisions
By leveraging both automated standups and advanced GitHub analytics, engineering teams can unlock a new level of performance and achieve their goals more effectively. The combination of Standupify and DevActivity offers:
- Enhanced Managerial Visibility: Managers gain a comprehensive dashboard of team health, progress, and areas needing attention, enabling proactive decision-making.
- Empowered Developers: Developers receive clear, objective feedback on their work, helping them understand their impact and identify opportunities for personal growth. The gamification aspect makes this process engaging and rewarding.
- Improved Team Collaboration: With transparent communication and shared performance data, teams can collaborate more effectively, understanding each other's contributions and challenges.
- Proactive Problem Solving: The ability to quickly correlate qualitative blockers with quantitative performance dips allows for faster identification and resolution of issues, minimizing project delays and technical debt.
- Data-Driven Culture: Moves the team towards a culture where decisions are backed by tangible data, leading to more effective process improvements and strategic planning.
Ultimately, a robust system for tracking developer KPI isn't about micromanagement; it's about empowerment. It's about giving teams the tools and insights they need to understand their own performance, iterate on their processes, and continuously improve. By combining the efficiency of automated standups with the depth of AI-powered GitHub analytics, engineering leaders can foster environments where developers thrive, projects succeed, and innovation flourishes.