Daily Report Dashboard: Monitor Team Progress in Standupify
The Daily Report Dashboard in Standupify offers a powerful visual summary of your team's and individual members' task progress over any selected period. It's designed to transform your daily updates into actionable insights, supporting efficient asynchronous standups and informed discussions.
Value to Your Team
The Daily Report Dashboard empowers users to:
- Monitor Team Progress: Gain quick insights into daily team task completion and progress against planned work.
- Identify Productivity Trends: Observe dynamics of planned vs. done tasks over time and pinpoint areas for improvement.
- Facilitate Informed Discussions: Enable shorter, more focused sync meetings by providing a pre-read visual summary of completed and in-progress tasks.
- Enhance Accountability: Clearly see individual and team contributions to task completion, fostering a sense of ownership.
- Streamline Standups: Reduce manual reporting by visualizing data collected automatically via the Google Chat bot.
Who Can Benefit?
This dashboard is an essential tool for:
- Team Leads: To oversee team output and ensure project alignment.
- Project Managers: For tracking overall project velocity and identifying potential bottlenecks.
- Scrum Masters: To facilitate daily standups with clear, data-backed insights.
- Individual Contributors: To understand their own contributions and track personal progress.
Key Use Cases
Leverage the Daily Report Dashboard for:
- Reviewing daily team output and progress.
- Comparing individual task completion rates and contributions.
- Identifying potential bottlenecks or consistently overdue tasks.
- Preparing for daily sync meetings by understanding team status at a glance.
- Tracking overall team velocity and project progress over time.
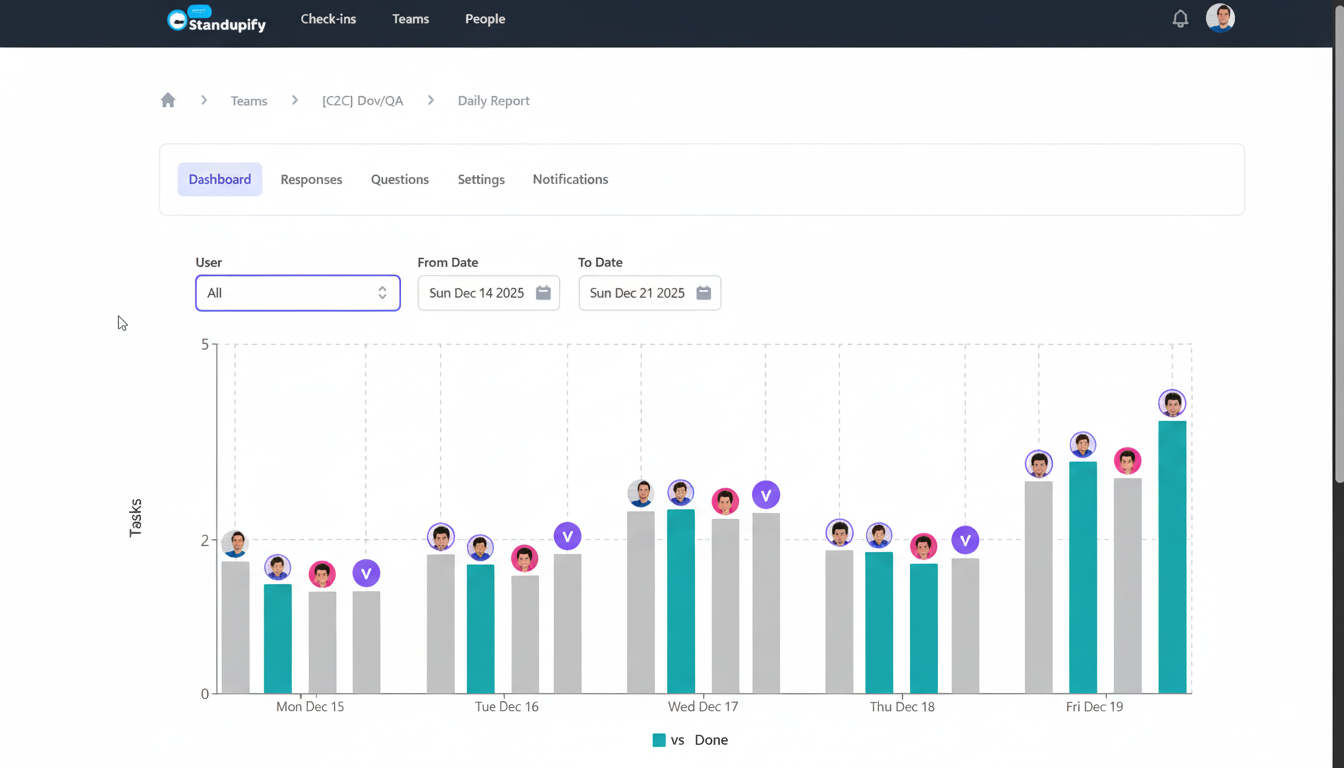
The core of the dashboard is a bar chart that displays the number of 'Tasks' on the Y-axis against specific days on the X-axis. Each day's data is represented by two types of bars: 'vs' (visualized in teal/turquoise) for planned tasks and 'Done' (visualized in gray) for completed tasks. This visualization helps teams identify trends in task completion, understand individual and team productivity, and foster accountability, supporting Standupify's goal of transforming daily updates into action-oriented discussions.
Frequently asked questions
What is the Daily Report Dashboard?
The Daily Report Dashboard in Standupify provides a visual summary of team and individual task progress, comparing 'planned' tasks against 'done' tasks as logged through the Google Chat bot.
How does the dashboard help monitor team progress?
It offers quick insights into daily team task completion and progress against planned work, helping you gain a clear overview of your team's output.
Can I see individual contributions on the dashboard?
Yes, you can filter the report by specific team members to analyze individual contributions and task completion rates over a selected period.
What do 'planned' and 'done' tasks refer to?
'Planned' tasks are those assigned or reported as in progress, while 'done' tasks are those completed and logged through the Standupify Google Chat bot during daily check-ins.
How does the dashboard streamline standups?
By providing a pre-read visual summary of completed and in-progress tasks, the dashboard reduces manual reporting and enables shorter, more focused sync meetings.